The Foundation: Understanding the Header Bidding Timeout
What is a Header Bidding Timeout?
In simple terms, a header bidding timeout is the maximum amount of time the header bidding wrapper (like Prebid.js) will wait for demand partners (SSPs) to return their bids before moving on with the ad auction.
Think of it like an auctioneer's gavel. When the auction begins, the auctioneer waits for bids to come in from the floor. The timeout is the moment they say "going, going, gone!" and slam the gavel down. Any bids that arrive after that moment are ignored, and the auction proceeds with the bids that were received in time. In the world of header bidding, your wrapper is the auctioneer, and the timeout is its gavel.
The Critical Trade-Off: Revenue vs. User Experience
The entire challenge of setting a timeout lies in a fundamental trade-off. There is no single "correct" number; there is only the optimal number for you, based on your specific goals and data.
The Case for a Longer Timeout
Giving the auction more time seems like an obvious win for revenue. A longer timeout allows more demand partners to respond, including those that might be geographically distant or simply slower to process the request. This increases two key factors:
- Bid Density: More partners returning bids means more competition for your inventory.
- Bid Quality: The highest bid might not always come from the fastest partner. A longer wait increases the chance of capturing a high-value, but slower, bid.
The result is often a direct increase in average CPMs and overall ad revenue for that specific page view.
The Case for a Shorter Timeout
On the other side of the coin is the user. In an era where attention spans are measured in seconds, a slow-loading page is a death sentence. A shorter timeout leads to faster ad rendering, which provides numerous benefits:
- Improved Core Web Vitals: Faster ad loads directly improve metrics like Largest Contentful Paint (LCP) and Interaction to Next Paint (INP), which are crucial for SEO.
- Better User Experience: A snappy, responsive site keeps users engaged and reduces bounce rates.
- Higher Ad Viewability: When ads load faster, they are more likely to be seen by the user, which increases their value to advertisers and boosts your long-term revenue potential.
***
[Visual Element: A line graph showing two curves. One line, labeled "Revenue Potential," starts low and rises quickly before flattening out. The second line, "User Frustration," starts at zero and rises steeply over time. The optimal timeout is marked at the point where the positive gap between the two curves is largest.]
***
The goal isn't to pick one side but to find the point of diminishing returns—the moment where waiting an extra 100 milliseconds for a potential bid is more likely to cost you a user than to earn you significant revenue.
Diagnosis: How to Analyze Your Current Timeout Performance

Before You Optimize, You Must Measure
The most common mistake publishers make is picking a timeout value (e.g., 1000ms) because they read it in a blog post. There is no "one-size-fits-all" timeout. The optimal setting for your site depends heavily on your specific mix of demand partners, your audience's geography, and their primary devices (desktop vs. mobile).
To move from guessing to knowing, you must first conduct a data-driven audit of your current setup.
Key Metrics to Track
Your header bidding analytics should provide a clear picture of how your auction is performing. Focus on these four critical metrics:
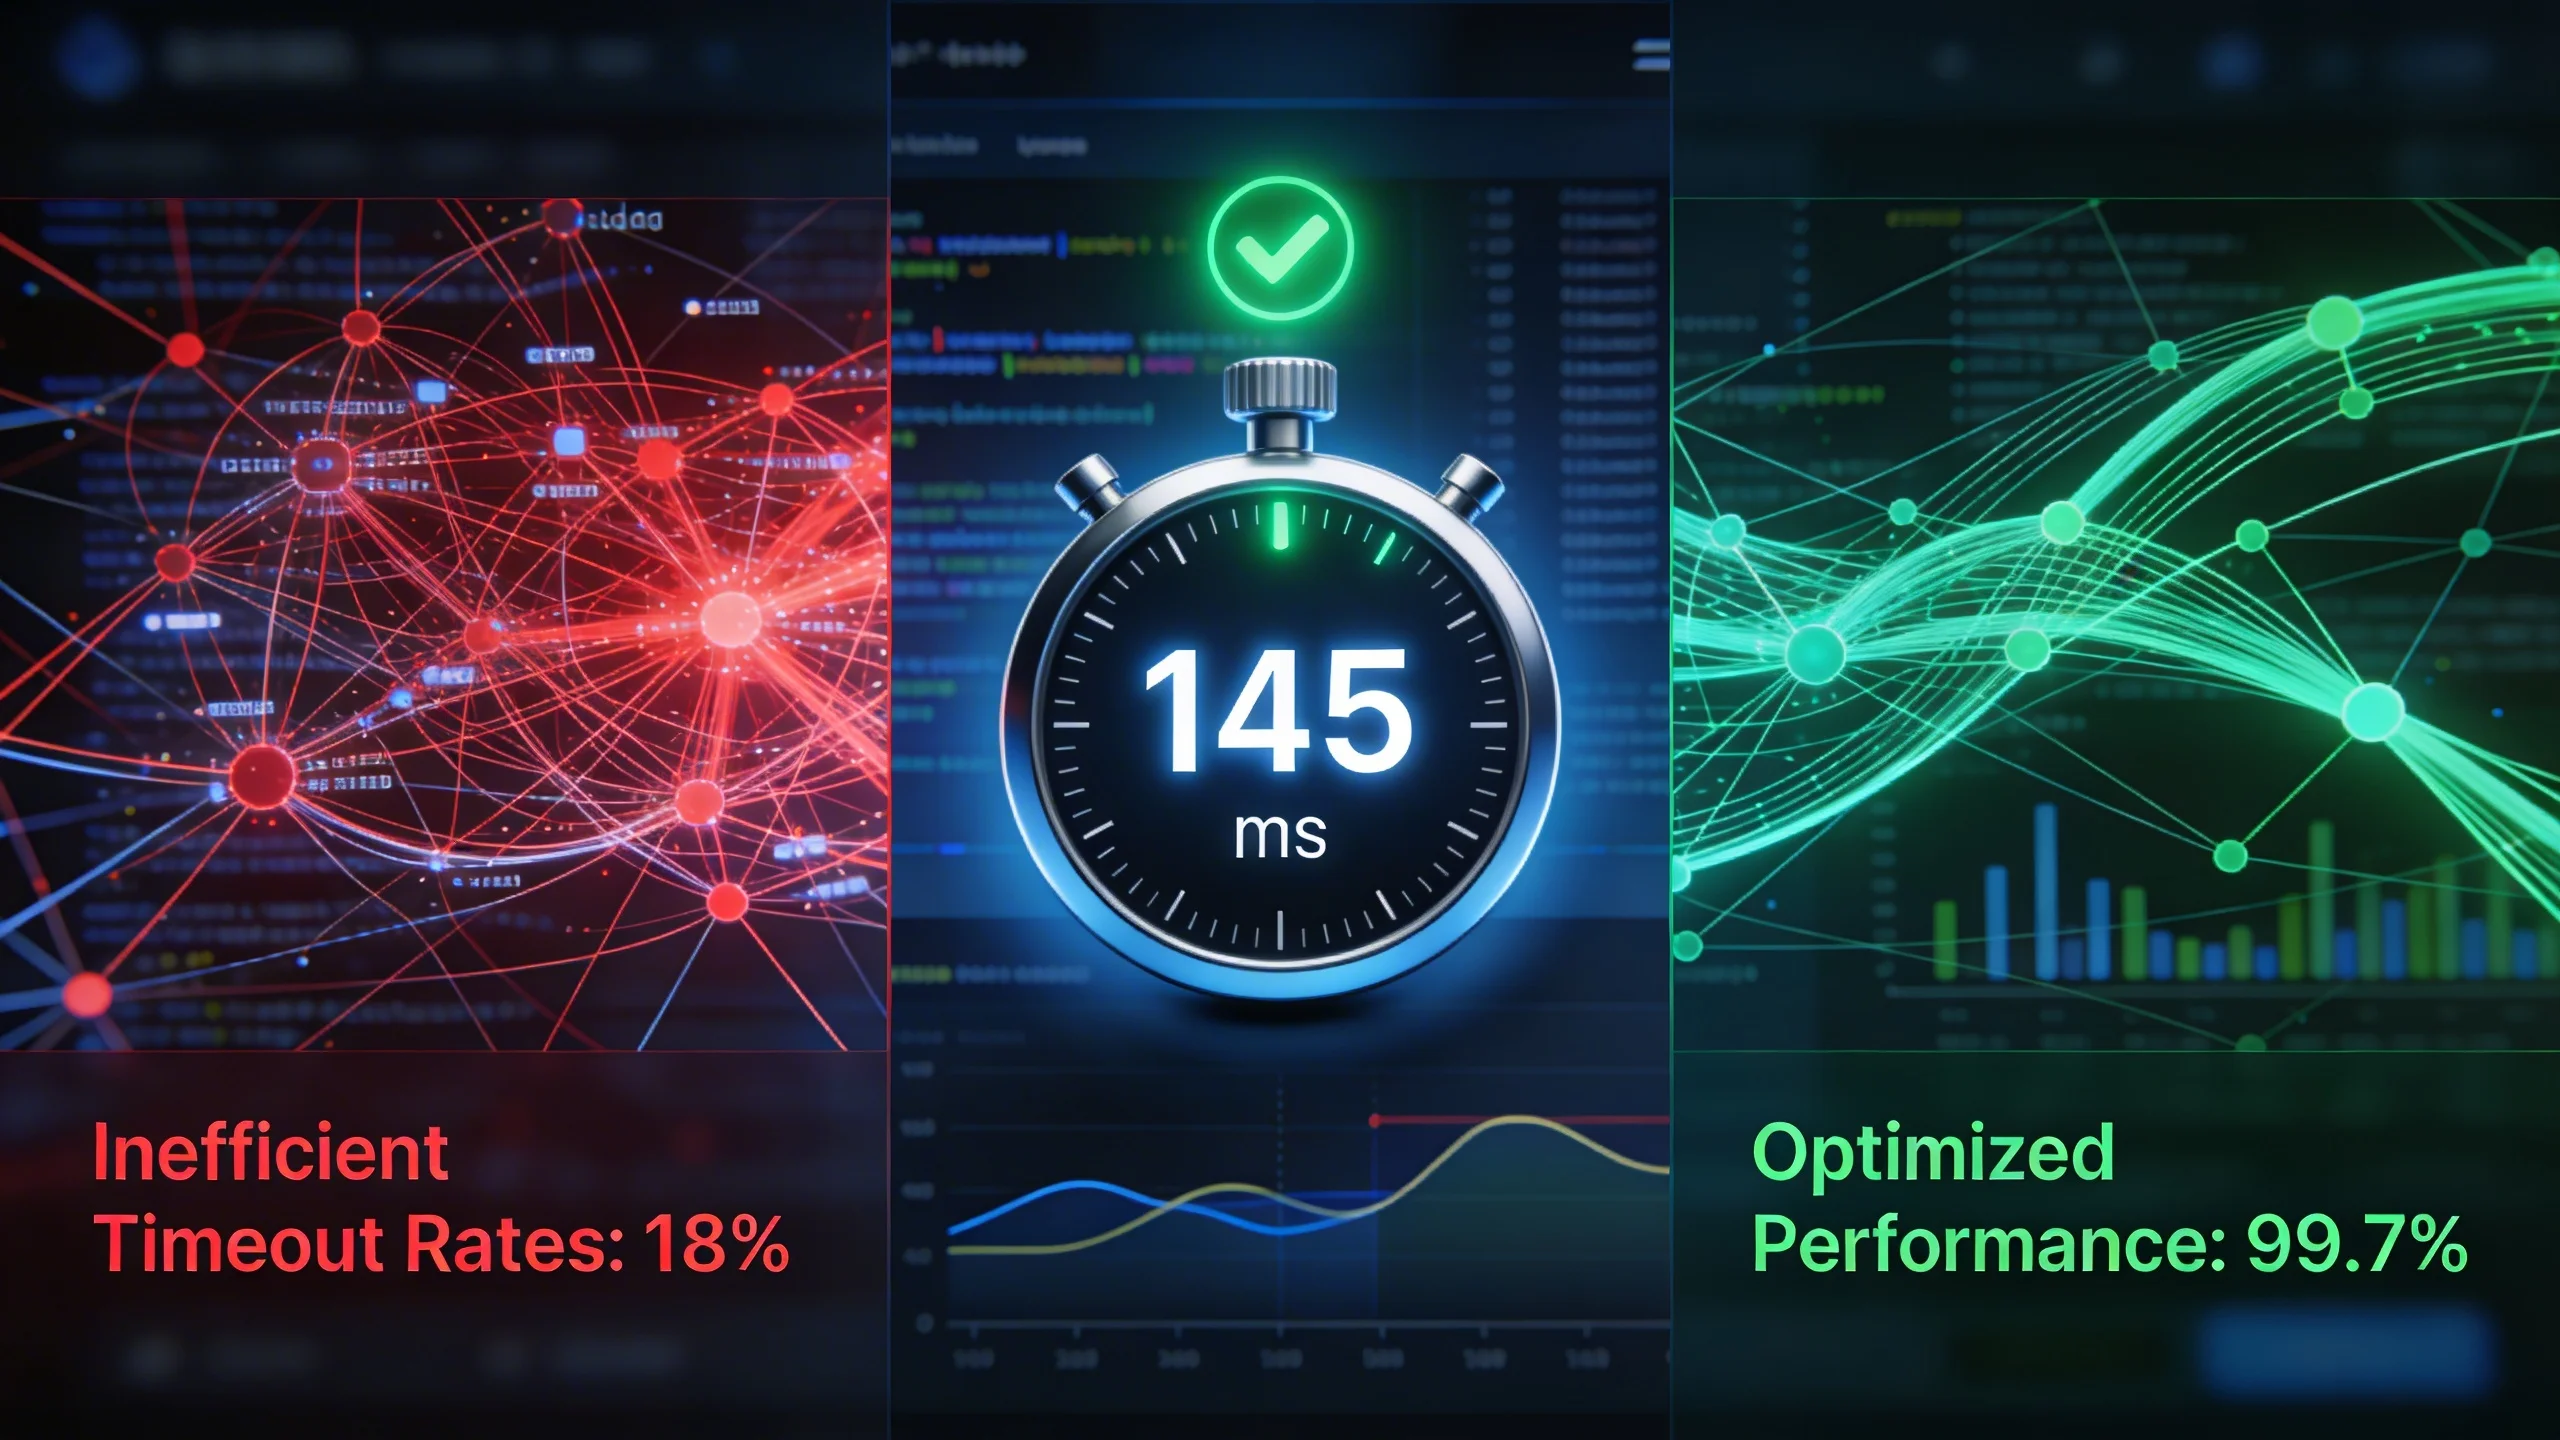
Timeout Rate (%)
This is the percentage of auctions where the timeout was reached before all requested bidders returned a response. A high timeout rate (e.g., over 20-30%) is a major red flag. It tells you that your auction is consistently being cut short, meaning you are very likely leaving winning bids on the table.
Average Bidder Response Time
This metric is your primary tool for identifying who is slowing down your auction. You need to know, on average, how long it takes each individual SSP to return a bid. A good analytics setup will show you this data for every partner, allowing you to quickly spot the outliers.
Revenue per Bidder
Latency doesn't tell the whole story. A slow bidder might be worth waiting for if they consistently deliver high CPMs and win a significant portion of your auctions. Track the revenue contribution of each partner to understand their true value. Never remove a slow partner without first confirming they aren't also one of your top earners.
Win Rate vs. Timeout Rate
This is a powerful correlation to analyze. Do the bidders who frequently time out also have a very low win rate? If a partner is both slow and rarely wins, they are providing all of the latency with none of the revenue. These are the first partners you should consider removing from your stack.
Tools for a Data-Driven Audit
You don't need to be a data scientist to gather this information. Several tools can provide the insights you need.
Google Ad Manager (GAM) Reporting
While not a direct header bidding tool, you can use GAM's robust reporting to get valuable insights. By passing header bidding data (like the winning bidder and winning CPM) as key-values into GAM, you can run reports to see which SSPs are actually winning auctions and at what price. This helps you validate the "Revenue per Bidder" metric.
Prebid.js Analytics Adapters
If you're using Prebid.js, analytics adapters are your best friend. These modules can send detailed, real-time auction data to a platform of your choice. Popular adapters exist for:
- Google Analytics: A free and accessible way to get basic performance data.
- Dedicated Ad Tech Platforms: Many companies offer advanced analytics suites that plug directly into Prebid, providing granular dashboards and reports on bidder performance, response times, and timeout rates out-of-the-box.
Third-Party Analytics Platforms
For publishers seeking a more streamlined solution, dedicated header bidding analytics platforms offer the most comprehensive view. These tools are built specifically to diagnose the issues discussed above, often presenting the data in intuitive dashboards that simplify the entire audit process.
***
[Visual Element: A mock-up of an analytics dashboard. It's a table with columns for "Bidder," "Avg. Response Time (ms)," "Bid Rate (%)", "Timeout Rate (%)", and "Revenue Contribution ($)." Some bidders are highlighted in green (fast, high revenue) and others in red (slow, low revenue).]
***
Core Strategies for Timeout Optimization
Once you have your data, you can begin the optimization process. These strategies range from foundational adjustments to advanced techniques, all aimed at finding your ideal balance.
Strategy 1: Setting a Smart Global Timeout
Your first step is to set a sensible global timeout that applies to all auctions. Instead of picking a random number, use the "80/20 rule" as your guide. Analyze your bidder response time data and find the time at which approximately 80-90% of your valuable bids have been returned.
For many publishers, this number falls within the 800ms to 1500ms range, but you must use your own data. If your report shows that 90% of your winning bids arrive within 950ms, waiting until 2000ms is pointless. You are adding over a second of latency for a very small chance at a higher bid.
Actionable Step: Pull a report of the response times for winning bids only. Find the 90th percentile response time. This is your data-driven starting point for A/B testing your global timeout.
A simple Prebid.js configuration looks like this:
pbjs.setConfig({

  bidderTimeout: 1200 // Set timeout to 1200ms

});
Strategy 2: Curate and Prune Your Demand Partners
This is often the single most impactful strategy for reducing latency. Not all SSPs are created equal, and a bloated demand stack is a primary cause of slow auctions. Be ruthless, but be data-driven.
Identify and Remove Consistently Slow Bidders
Using your analytics, identify partners who consistently have a high average response time and a low win rate. If an SSP is frequently taking 1500ms to respond but has only won 0.5% of auctions in the last month, they are dead weight. Removing them will speed up your auction for all other partners with minimal impact on revenue.
Evaluate Bidders by Geography
A demand partner that is lightning-fast in North America might be painfully slow in APAC due to server distance. If you have a global audience, segment your bidder analysis by geography. You may find that certain partners should only be called for traffic from specific regions.
A/B Test Your Partner Mix
Don't make changes in a vacuum. Form a hypothesis, such as "Removing Bidder X will improve our page load speed and have a neutral or positive impact on overall revenue." Then, run a controlled A/B test where one group of users has Bidder X in the auction and the other does not. Measure the impact on page speed, viewability, CPMs, and total session revenue.
Strategy 3: Implement Bidder-Specific Timeouts (Advanced)
For ultimate control, some managed Prebid solutions and advanced setups allow you to move beyond a single global timeout. With bidder-specific timeouts, you can give a consistently high-value but slightly slower partner a bit more time (e.g., 1200ms), while holding your faster, lower-value partners to a stricter deadline (e.g., 800ms). This expert-level technique allows for fine-grained optimization but requires a sophisticated setup to manage effectively.
Strategy 4: Leverage Server-to-Server (S2S) Integration
The latency discussion so far has focused on client-side header bidding, where the auction runs in the user's browser. Server-to-Server (S2S) header bidding offloads this process to an external server.
- Client-Side: The user's browser makes individual calls to every SSP. More partners mean more browser connections and more potential for slowdown.
- Server-to-Server: The user's browser makes a single call to an S2S server. That server then conducts the auction with all SSPs and returns the winning bid to the browser.
This dramatically reduces the performance impact on the user's device. The best approach for many publishers is a hybrid model: keep your 3-5 fastest and highest-value partners on the client-side for maximum competition, and move the rest of your demand stack to a server-to-server integration. This gives you the best of both worlds: speed and robust demand.
Strategy 5: Optimize Your Prebid.js Configuration
Finally, ensure your technical setup is not creating unnecessary latency.
- Enable Bidder Aliasing: If you work with the same SSP through multiple resellers or seats, aliasing allows you to call them once instead of multiple times, streamlining the process.
- Use the Latest Prebid Version: The Prebid community is constantly working on performance improvements. Ensure you are running an up-to-date version of the library.
- Implement Lazy Loading: For ad units "below the fold," there's no reason to run an auction on page load. Configure lazy loading to only initiate the auction when the user scrolls near the ad unit. This drastically improves initial page load times and overall Core Web Vitals.
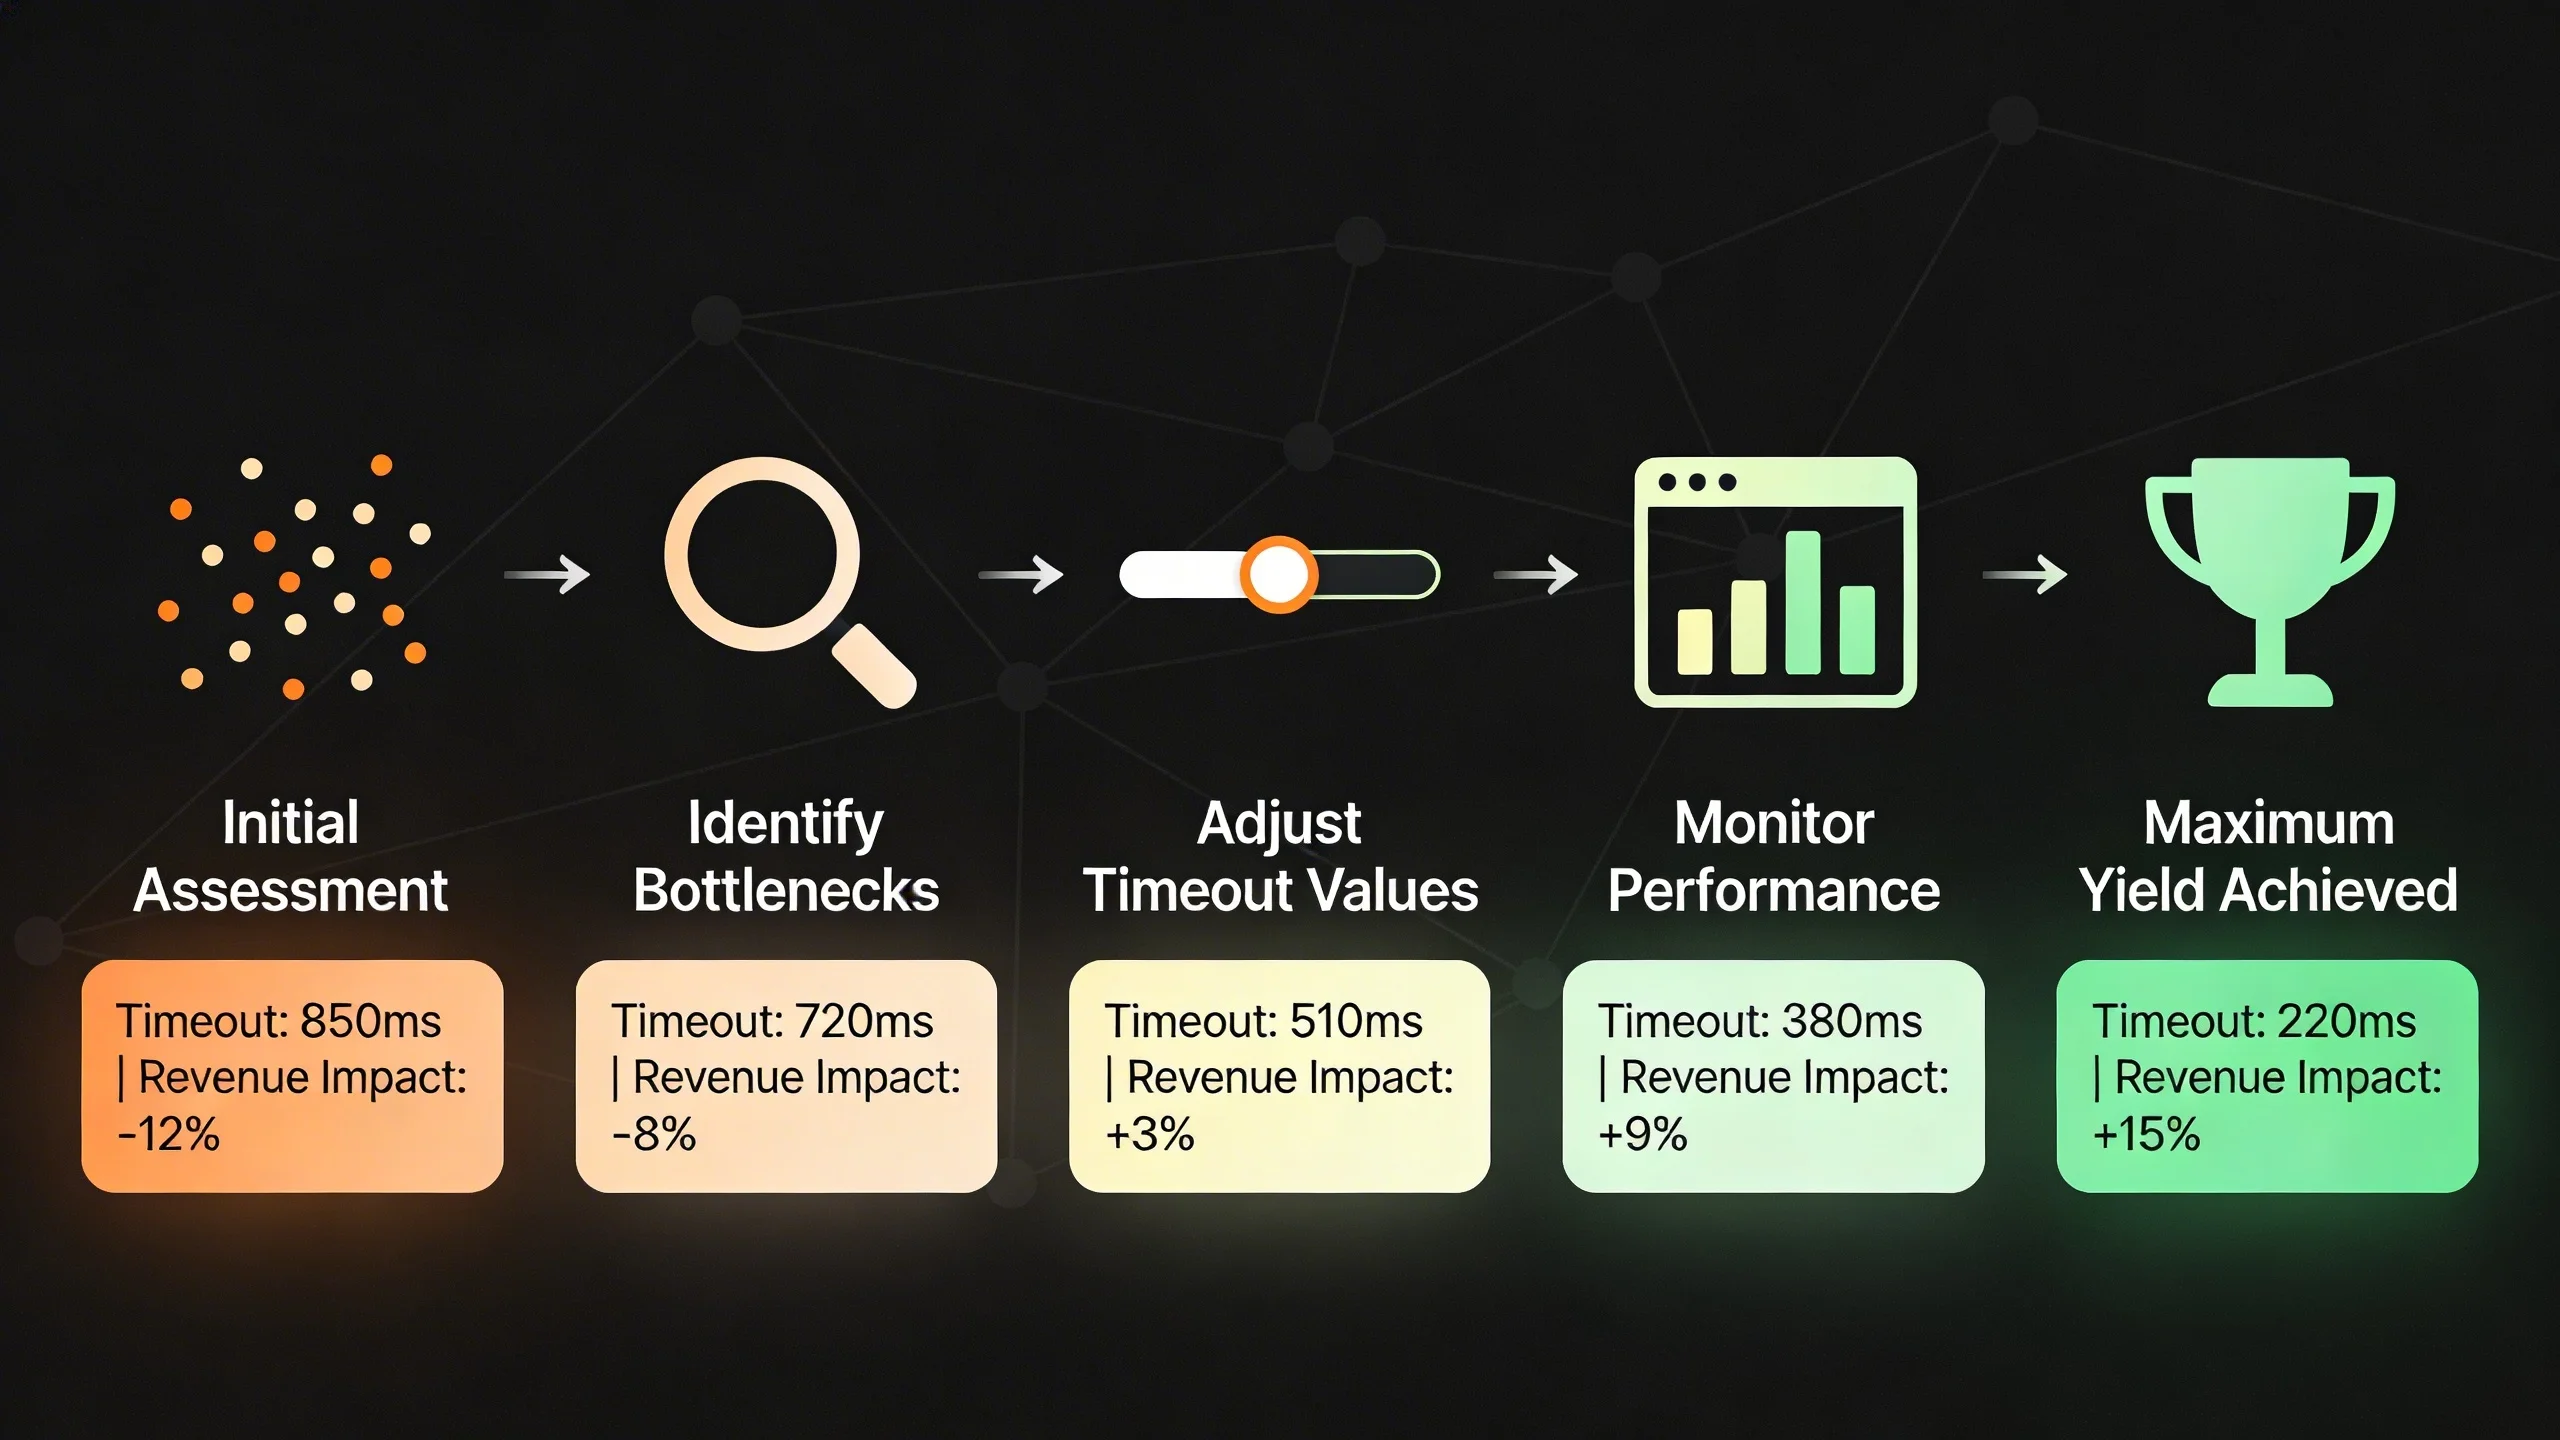
The Continuous Optimization Loop: A Step-by-Step Framework
Optimizing your timeout is not a "set it and forget it" task. It's a continuous process of testing and refinement. Follow this 5-step loop to build a system for maximizing yield.
***
[Visual Element: An infographic diagram showing a circle with five labeled points: 1. Benchmark, 2. Hypothesize, 3. A/B Test, 4. Analyze, 5. Iterate. Arrows connect them in a loop.]
***
Step 1: Benchmark
Use the tools and metrics from the "Diagnosis" section to establish your baseline. Document your current global timeout, average timeout rate, key page speed scores (LCP, INP), and average session revenue. This is your starting point.
Step 2: Hypothesize
Formulate a clear, testable hypothesis based on your data. For example: "I believe reducing my timeout from 1500ms to 1200ms will increase ad viewability by 5% and net session revenue by 2%, despite a slight drop in bid density from our slowest partners."
Step 3: A/B Test
Use a testing tool (like Google Optimize or a feature built into your ad management platform) to run a controlled experiment on a segment of your traffic (e.g., 10% with the new timeout vs. 10% with the old). Crucially, measure the full picture. Don't just look at CPMs. Track overall session revenue, user engagement metrics (pages per session, bounce rate), and Core Web Vitals.
Step 4: Analyze
After running the test for a statistically significant period (e.g., 1-2 weeks), analyze the results. Did the change have the desired effect? Did revenue go up, but user engagement went down? Look at the holistic impact on both monetization and user experience to declare a true winner.
Step 5: Iterate
If the test was successful, roll out the change to 100% of your traffic. Your new setting becomes the baseline. If the test failed or was inconclusive, use the data to form a new hypothesis and test again. Perhaps the next test involves removing a slow bidder or moving them to S2S. This cycle never ends.
Conclusion
Optimizing your header bidding timeout rate is a dynamic process of mastering the trade-off between speed and monetization. The path to maximum yield isn't about finding one perfect number that will last forever. It's about rejecting guesswork and building a system of continuous, data-driven testing and analysis.
By understanding the metrics that matter, leveraging the right tools, and implementing a strategic testing framework, you can turn your timeout setting from a liability into your most powerful lever for revenue growth.
Start your timeout audit today. Analyze your bidder data, form a hypothesis, and launch your first A/B test to unlock the hidden revenue waiting in your ad stack.
---
Frequently Asked Questions about Header Bidding Timeouts
Q1: What is a good header bidding timeout?
There's no single answer, but a common starting range for testing is 800ms-1500ms. The best timeout is not a number you read online; it's the one you discover for your specific site through rigorous data analysis and A/B testing.
Q2: How does header bidding timeout affect Core Web Vitals?
A longer timeout can delay the browser's main thread as it waits for bids, which can negatively impact key metrics like Largest Contentful Paint (LCP) and Interaction to Next Paint (INP). A well-optimized, shorter timeout leads to faster ad rendering and a better user experience, which is crucial for both SEO and long-term revenue.
Q3: Should I remove all my slow bidders?
Not necessarily. If a slow bidder provides exceptionally high CPMs and wins frequently, they may be worth the wait. The key is to analyze their revenue contribution versus their latency impact. If a partner is slow and doesn't win often, they are a prime candidate for removal.
Q4: What's the difference between a Prebid timeout and a GAM timeout?
The Prebid timeout is for the client-side header bidding auction; it's the time the wrapper waits for SSPs to respond. The Google Ad Manager (GAM) timeout is a final backstop within the ad server. It dictates how long GAM will wait for the entire page's ad requests to be filled before it gives up. The Prebid auction must complete well before the GAM timeout is reached.